
Your margin bridge explains only half the story.
Margineo explains the other half. Every driver, every mix, every interaction.
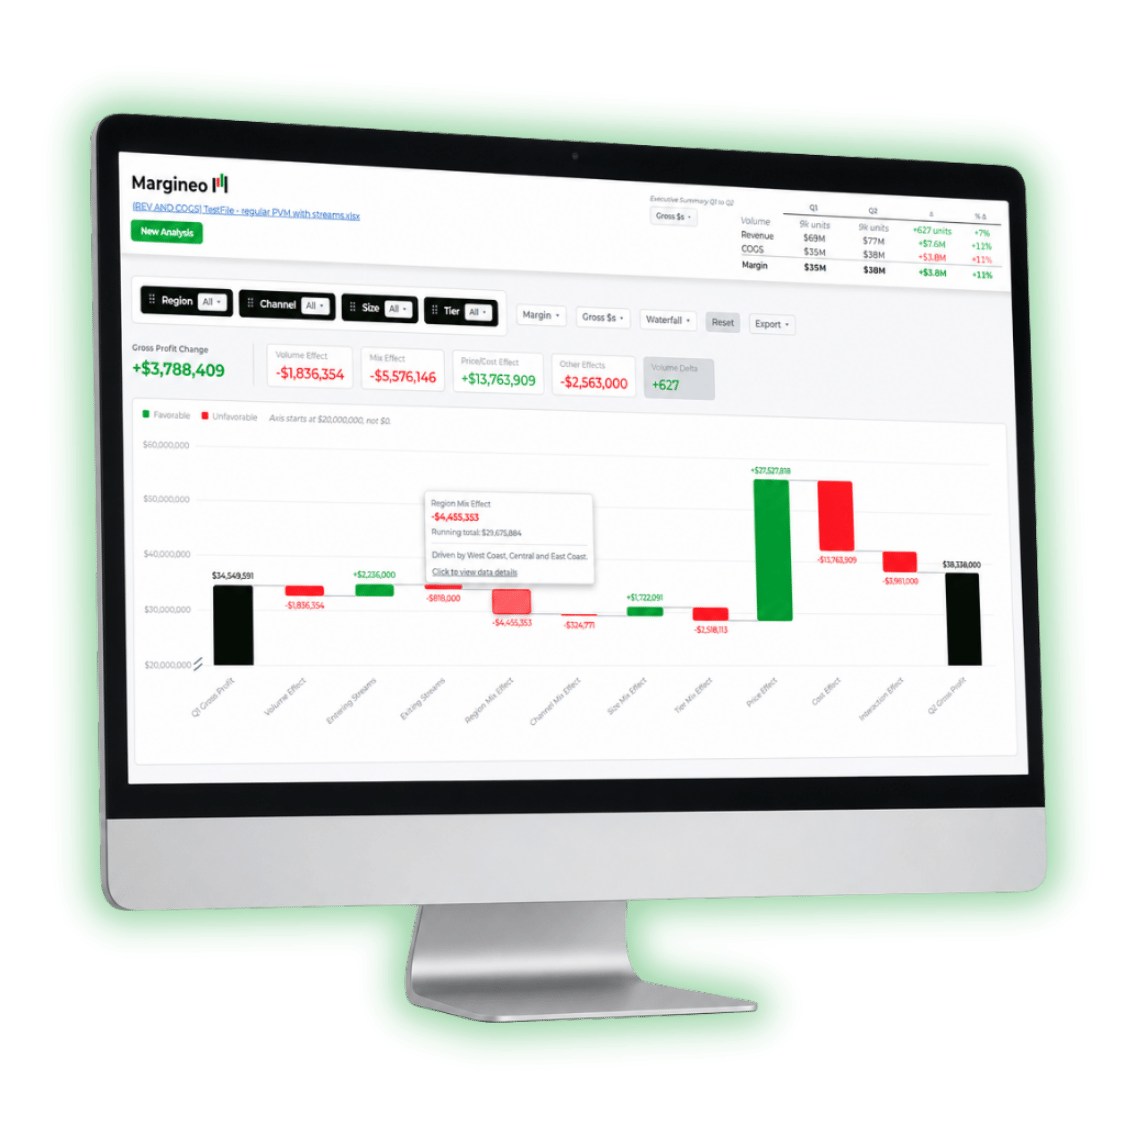
Control all your margin dynamics
Price Effects
•
Cost Effects
•
Volume Effects
•
Price/Cost/Volume interactions
•
FX Impact
•
Unlimited mix analysis: region, product, sales channel, factory, etc.
•
Interactions between mixes
•
New and discontinued products/markets
•
Fixed vs variable cost absorption with volume changes
•
Other effects and interactions
•
Price Effects • Cost Effects • Volume Effects • Price/Cost/Volume interactions • FX Impact • Unlimited mix analysis: region, product, sales channel, factory, etc. • Interactions between mixes • New and discontinued products/markets • Fixed vs variable cost absorption with volume changes • Other effects and interactions •
No more vague profit stories
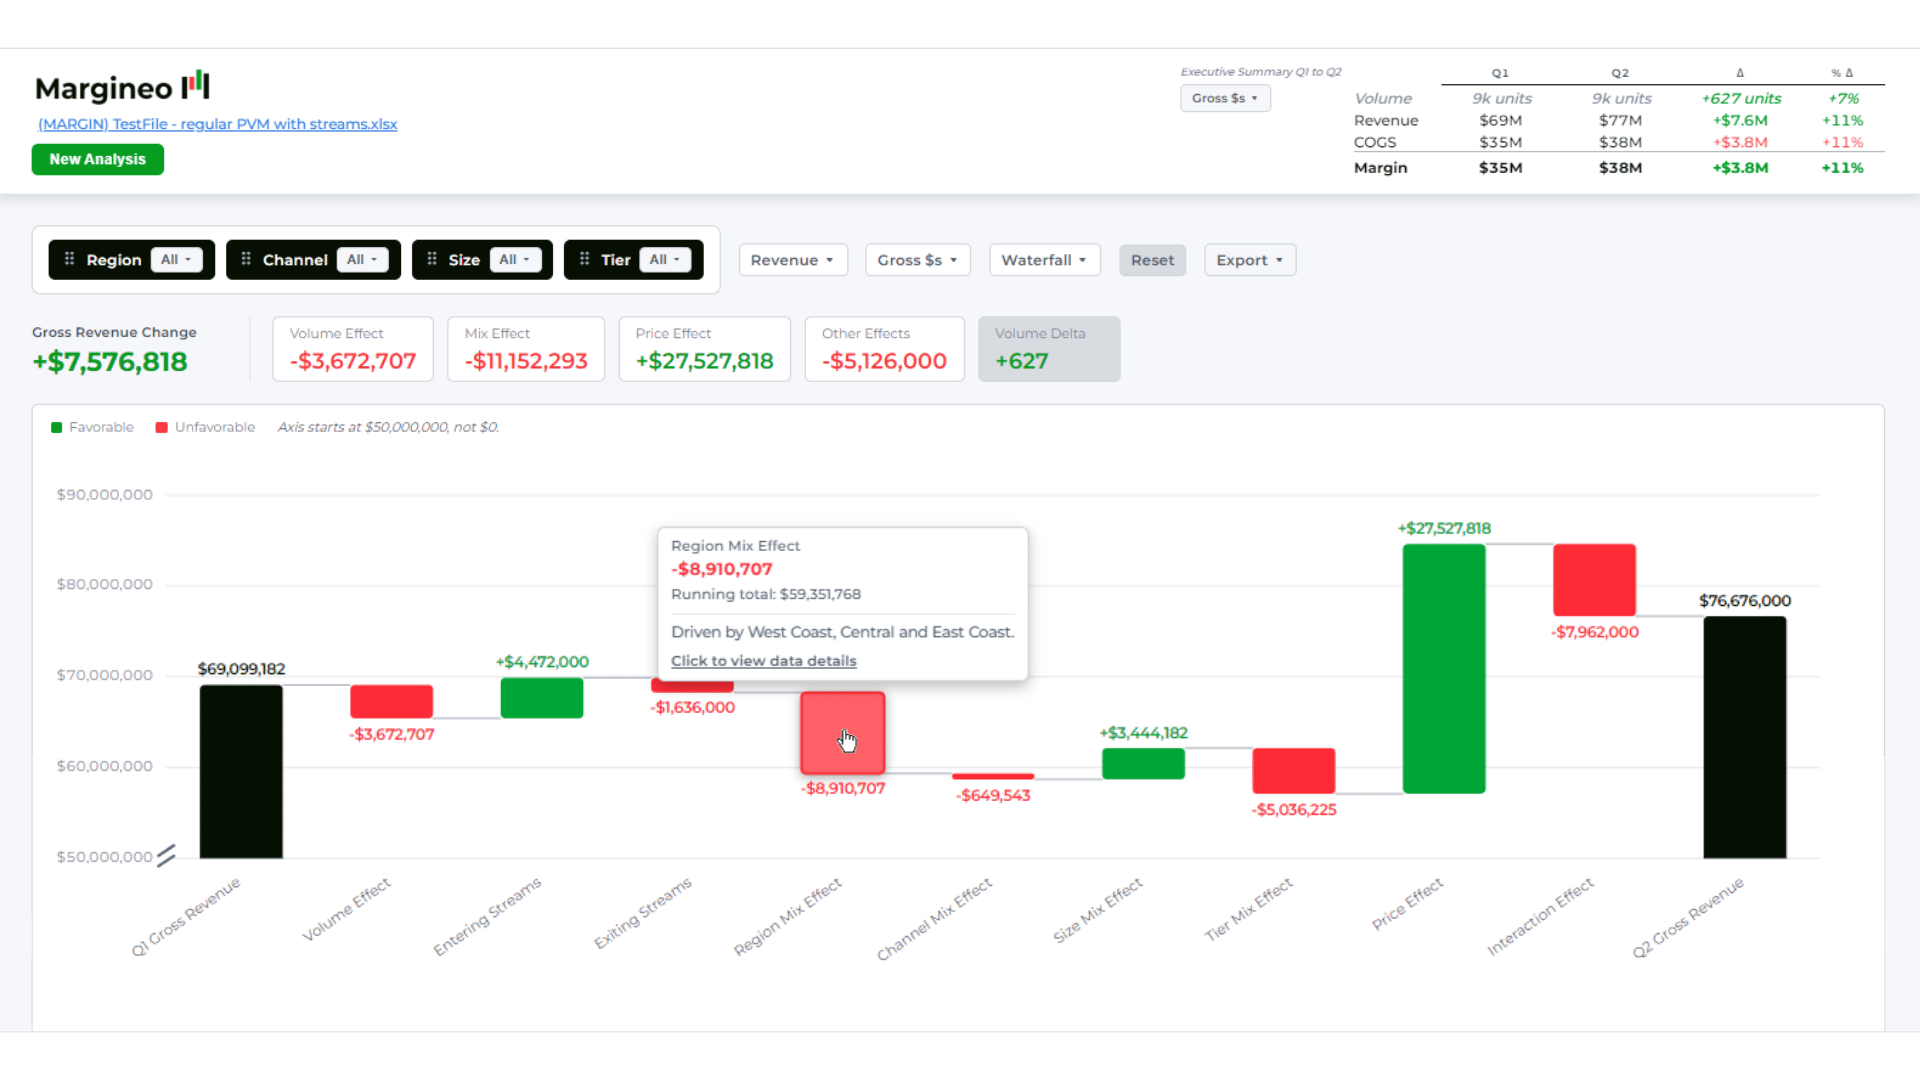
Surface every profit driver in seconds. Reveal hidden interactions and decompose mix into its subcomponents like product, channel, region and factory. Drill from the big picture down to the SKU level. Every effect is fully attributed and auditable, with no plug variables or subjective allocations.

Secret CFO
Former CFO of multi-billion manufacturing enterprise and author of CFO Secrets, read weekly by 50,000+ finance leaders
Pull the right lever
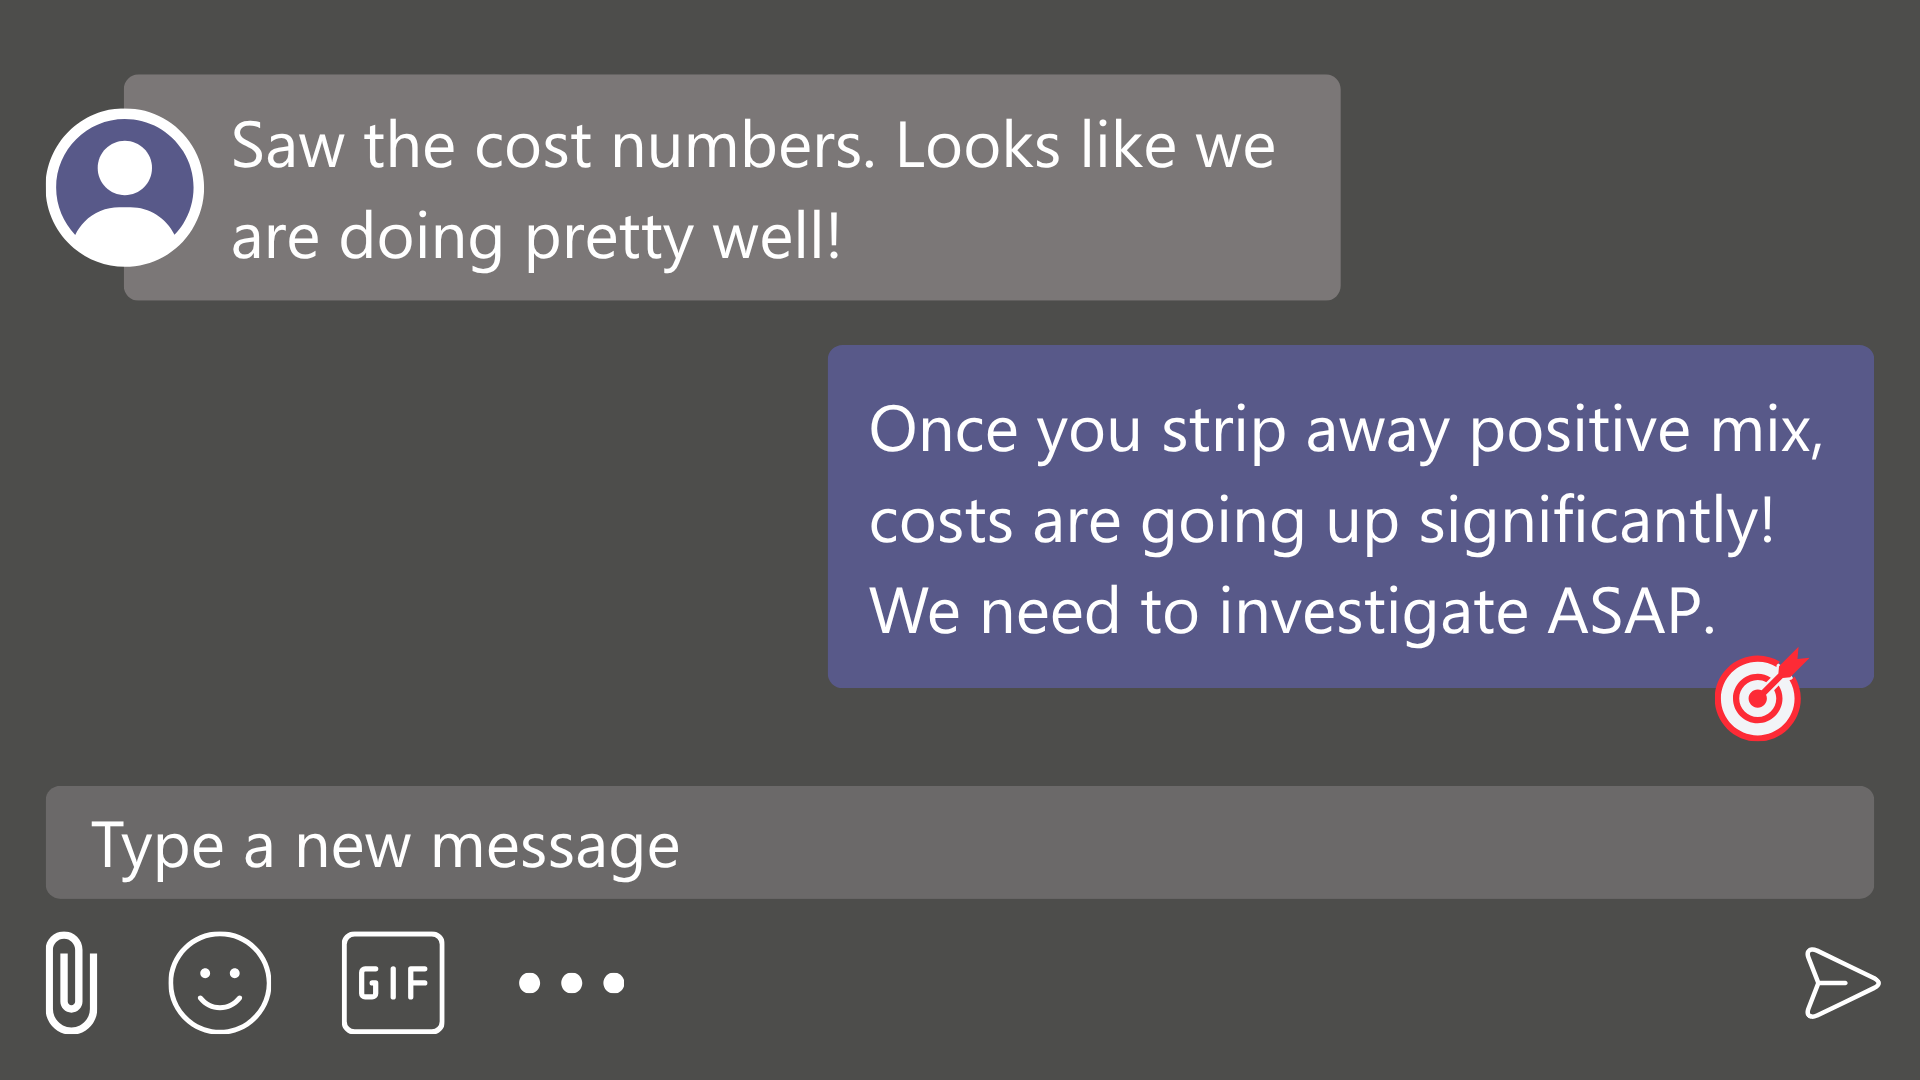
Validate business instincts with real data. A cost increase might require SKU-rationalization, not supplier negotiation. Declining regional volumes might call for mix adjustments, not price cuts.
Every variance gets an owner
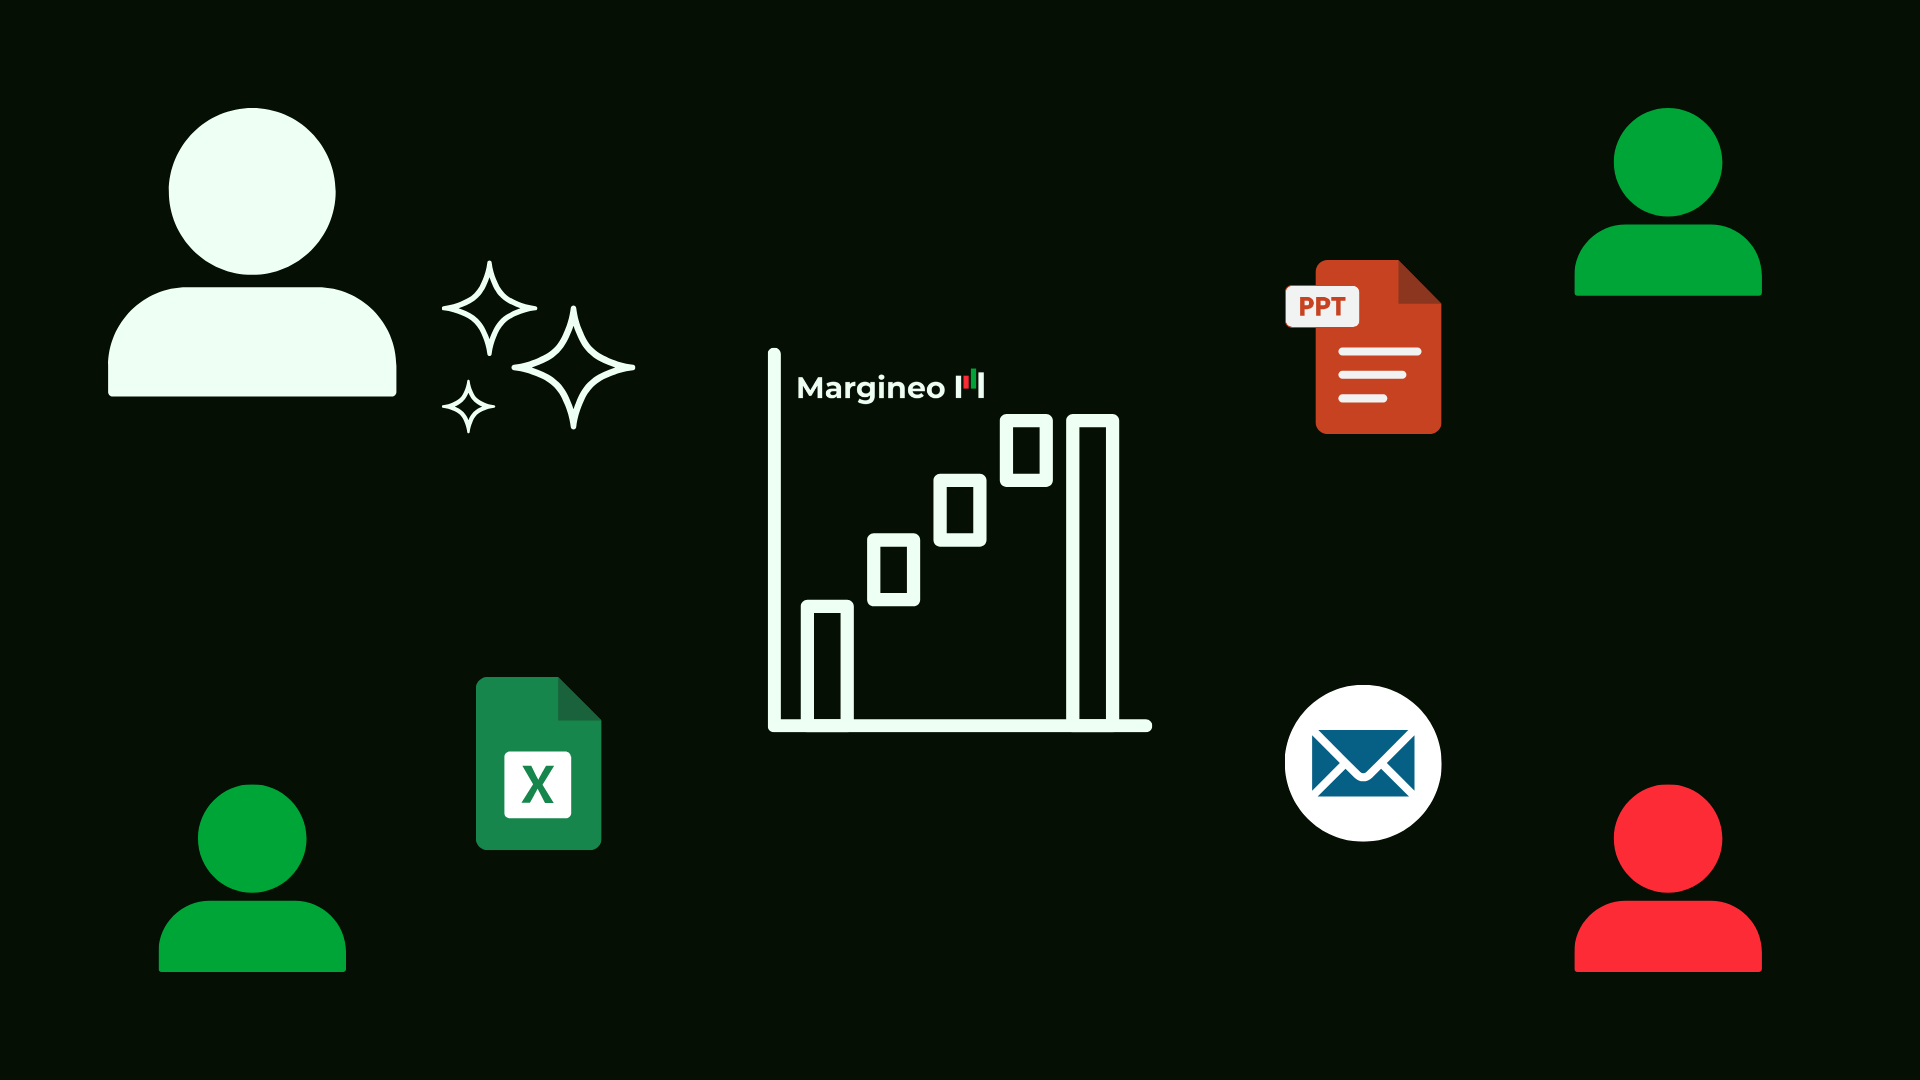
Trace each movement to a pricing, go-to-market, product, operations or procurement decision. Drive accountability with automatically generated Excel, PowerPoint and email exports.
“We recovered +500 bps of profit in 6 months! Margineo diagnosed severe SKU mispricing we could have never seen without their advanced price-volume-mix analysis.”
CFO of +$1B manufacturing firm
Case study available under NDA
No complex rollout, no data exposure
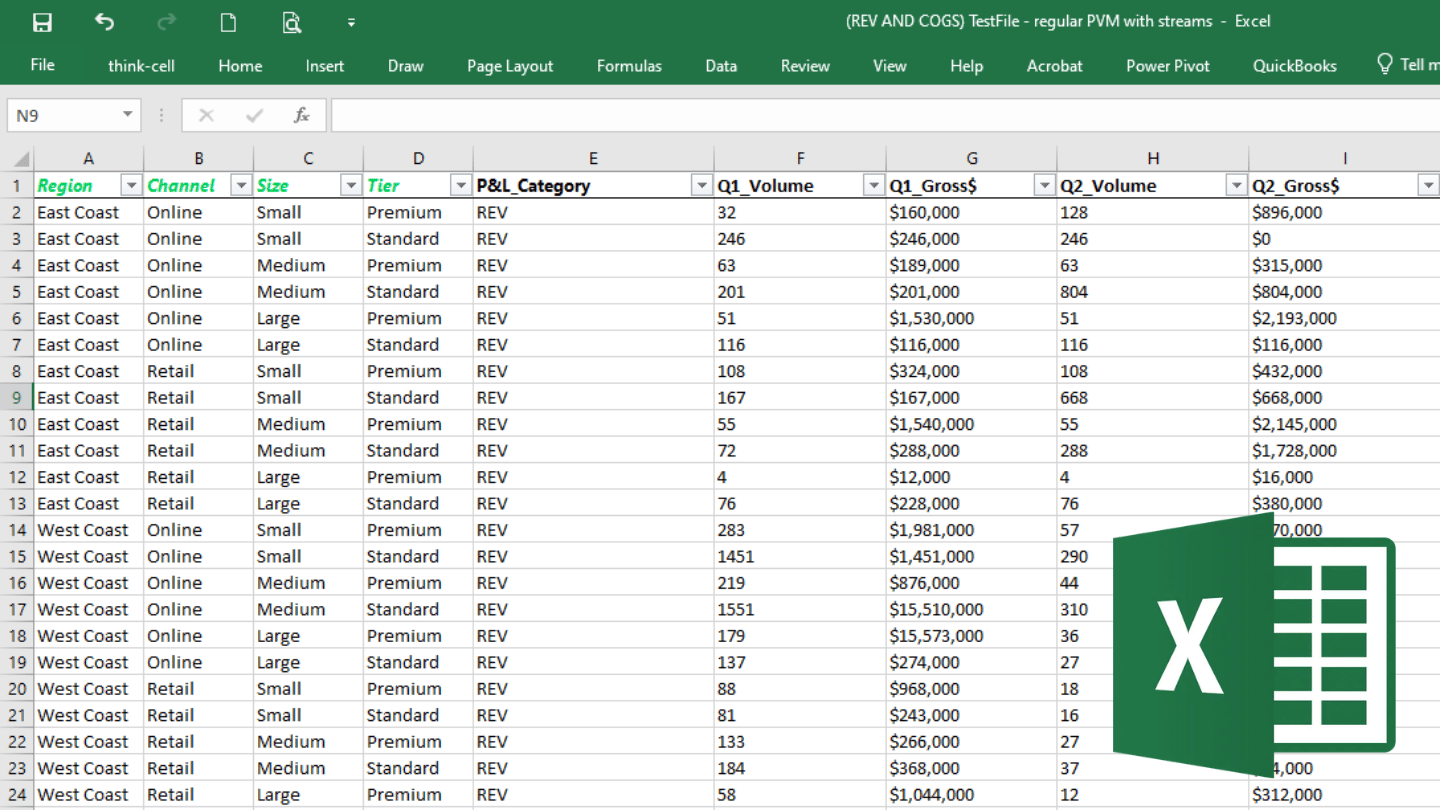
Drop revenue, COGS, and margin into a structured Excel template and run your first analysis in seconds. Margineo installs as a desktop application on your own machine and lives entirely on your premises, so your P&L never leaves your environment.
Product Tour
Margineo in action
Frequently Asked Questions
-
Though you could build the case on time saved alone, if Margineo surfaces just one actionable insight over 12 months, it pays for itself many times over. One customer recovered +500 bps in six months, while another uncovered roughly +1,000 bps of margin opportunity on their first trial (case studies available under NDA). There’s another return that doesn’t show up in a business case: the confidence of knowing that if something is hiding in your margin, you’ll spot it.
-
Quarterly at minimum. Most teams run it monthly, some weekly. Forecast to forecast. Actuals to forecast. Actuals to actuals. Board and investor relations packs. MBRs and QBRs. Cost reviews. Regional and business-unit deep-dives, or the whole company at once. Tracking a single product line. Modeling a decision before you commit to it.
-
There's nothing to integrate in the usual sense. Margineo installs as a desktop application on your own machine and runs entirely on your premises, so your P&L never leaves your environment. There's no data pipeline, no new source of truth, and no competing system to reconcile. We work with your IT team directly, and because nothing leaves your environment, that review is usually short. Onboarding is included, and we stay available beyond it.
Don’t think of Margineo as additional software. It's the capability you're already trying to build in Excel. Data requirements are simple and you almost certainly meet them already: revenue, COGS and volume at the granularity you already report. Drop it into a structured Excel template and run your first analysis in seconds.
-
Some teams do. The math is genuinely complex, and the difficulty grows sharply with every dimension you add. Interactions between those dimensions are where most in-house models quietly break. On more than one occasion, teams came back to us several months into an in-house build gone wrong.
The real question isn't whether it's possible. It's whether it's the best use of your analysts and engineers for the next year. Either way, see ours running on your own data first before committing to such a project.
-
Our calculation methodology is transparent and you can audit every result yourself. No plug variables, no subjective allocations: every effect is fully attributed and traceable back to the original source data. We’re open about how the math works because that isn’t the only place where our advantage sits. It’s in the tool itself: the interface, the outputs, and the expertise that went into building both.
See the other half of your profit story
Schedule your own personal walk-through and unlock a risk-free trial.
Need more information?